Home
Error Free? Spreadsheet Risks and Techniques
Dr Anthony Berglas, SCSQ
Anthony@SpreadsheetDetective.com
Peter Hoare, KPMG
Published in Australian CPA, 68 (3) , April 1998 pp 42–45
Introduction
Spreadsheets have become an essential tool for performing financial
modelling and analysis because they enable powerful emulation of real
world business opportunities. This enables comprehensive models
to be built for financial forecasting using business drivers such as
market share and production yields. These models enable the input
values to be easily varied to perform “what-if” analysis or even apply
Monte Carlo simulation to gain a better understanding of the potential
impact of business risks on the bottom line.
The example in exhibit 1 has been used to model the profitability of
producing a product, and the Excel Solver has then been used to
determine the optimum Price. This would be difficult to do
accurately using paper based calculations or calculus. Based on
this model one can confidently begin a marketing campaign advertising a
price of $31.50. One could then just as confidently sustain a
significant loss because like many spreadsheet models, this one
contains serious errors!
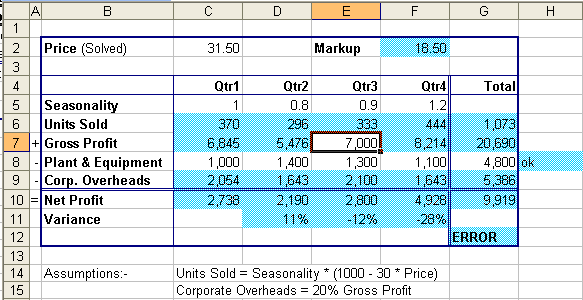
Exhibit 1
Error Studies
There is considerable evidence that a large proportion of spreadsheets
that are used to make important decisions contain substantial
errors. For example, Freeman 1996 reports that a survey
found that 90% of spreadsheets with over 150 rows contained at least
one significant formula mistake. www.cba.hawaii.edu/panko/ssr
provides several anecdotes of spreadsheet errors that had cost
companies millions of dollars.
Errors can be hard to find, as illustrated by Galletta et al 1996 who
performed an experiment in which 113 MBA students were asked to
validate a single model seeded with eight errors, but on average only
half the errors were identified. Galletta also noted that
subjects were more accurate when working with printed reports rather
than debugging spreadsheets interactively. Davis & Ikin 1987
audited 19 operational models and found that 4 had serious errors
despite the fact that the subjects were very confident that the
spreadsheets were error free. Panko 1998, also
performed an experiment in which subjects stated they considered that
there was an 18% chance that their completed spreadsheets contained
errors, while in fact 86% contained errors. Moreover, there was
no correlation between each subject's level of confidence and the
integrity of their completed spreadsheets.
This overconfidence is perhaps the most serious aspect of spreadsheet
errors because it reduces the extent to which people validate their
models before using them to make important decisions. Mistakes
that make large changes to output values are relatively easy
detect. It is the errors that lead to subtle but important
changes that are most dangerous because they can be very hard to detect
but still lead to seriously flawed conclusions.
Techniques for building models
A useful technique is to clearly identify cells that contain formulas
as opposed to just constants. Cells with formulas can be
automatically selected in Excel by using the Edit/Go To/Special dialog
or by the Tools/Audit dialog in 1-2-3 version 5. The format of
the selected cells can then be updated, perhaps by setting the
background colour to blue as illustrated by exhibit 1. This makes
it easy to see that cell E7 does not have a formula, which is clearly
an error. The new version 97 of 1-2-3 has replaced the Audit
dialog with a new option that enables dots to be automatically placed
in cells with formulas, and the use of this option is strongly
recommended. If a spreadsheet is to be used by people other than
its author, it is also good practice to protect those cells with
formulas from being modified.
Another common and subtle source of error results from formulas that
have not been copied consistently throughout a spreadsheet. This
can checked in Excel by using the Go To / Special dialog or the
"Ctrl+\" and "Ctrl+|" keys to select cells that are inconsistent with
the first column (or row) within a range of cells. Exhibit
2 shows the result of selecting the range C5:F11 and then pressing
"Ctrl+\". This shows that cell F9 is inconsistent with cell
C9. Excel has also selected the range D11:F11 even though these
cells are consistent because they are not consistent with the empty
cell C11, and so this range needs to be checked separately by first
selecting D11:F11 and then pressing "Ctrl+\" again. Likewise the
range G6:G10 needs to be selected before "Ctrl+|" is pressed.
Applying this option repeatedly throughout a spreadsheet and
interpreting the somewhat cryptic results is tedious, but inconsistent
formulas are a potentially serious source of error.
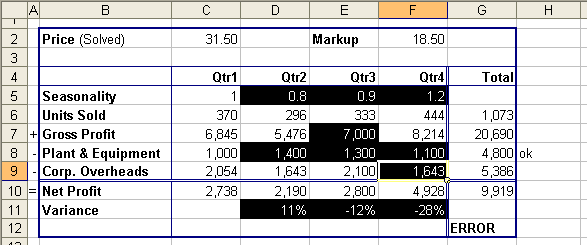
Exhibit 2
Another problem in larger spreadsheets it that it can be difficult to
validate "A1" cell references. In the example, it is difficult to
understand the formula "=Price - Prod!E56" in cell F2 because
"E56" does not describe the meaning of the cell being referred
to. To address this problem, a range may be given a Name
which can then be used within the formulas. In the example, the
Name "Price" has been defined to refer to the range C2, and then the
Name "Price" has been used in the formula in cell F2. The
use of Names makes formulas easier to understand but can be very
misleading if a Name's definition is incorrect. In the example,
cell C10 contains the formula "= C7 - PlantEquip - C9", but the Name
PlantEquip actually refers to row 9 and not row 8. For this
reason Names should only be used for cells that are referenced by
several different formulas, and then the definitions of these Names
needs to be checked carefully.
Excel 97 has also introduced a new "natural language" capability which
enables cell labels such as "Plant & Equipment" to be entered
directly into formulas. However, this requires Excel to use
heuristics to infer which cells are actually being referenced, which
can occasionally produce misleading results. We therefore
recommend that if this feature is used at all that extreme care be
taken.
The following guidelines should also be used when writing spreadsheets:-
- Never place constants in formulas. In the example the
formula in C6 is "=C5*(1000-20*Price)", which hides the assumptions
about the elasticity of the market and so makes it more difficult for
others to use or review the model.
- Follow a simple input-output structure. Real world
businesses convert inputs to outputs and deliver a financial
result. Likewise, a financial model should be structured to
utilize business inputs and emulate the business processes to produce
the financial outputs. For example, inputs may include market
data, production data, overhead drivers to produce the model outputs of
sales, operating costs and earnings.
- Repeat important input values from other worksheets. In the
example, a cell labeled "Unit Cost" could have been included with
the formula "= Prod!E56", and then this cell could be referenced by the
Markup formula. This would make it easier to understand how
the Markup was calculated, and means that the printed worksheet tells a
more complete story.
- Break up long, complex formulas into small chunks that can be
verified independently. In the example, it would be possible to
calculate the Gross Profit in one step as "= C5 * (1000 - 20 * Price) *
(Price - Prod!B56), but this is difficult to follow. If adding
intermediate results makes a worksheet too big for a report, then
create a second summary worksheet which just contains references to the
important cells in primary worksheet that calculates them.
- Avoid having formulas that refer to other cells below them or to
their right. Apart from avoiding circular references, this
clarifies the meaning of the spreadsheet by suggesting the dependency
relationships between cells.
- Document important formulas in the worksheet. In the
example, the Units Sold formula has been shown explicitly.
However, care must be taken that the documentation actually reflects
the formulas, otherwise it can be extremely misleading. The
example also demonstrates the use of "+"s and "-"s to the right of the
labels to show how the net profit was calculated.
- Add redundant verification formulas to the model. In the
example, cell G12 contains the validation formula "=IF(G7 - G8 - G9
<> G10, "ERROR", "ok")" which highlights one of the formula
errors in this model.
- Collect redundant input values and use validation formulas to
check the results. In the example, the user is expected to
redundantly enter the total cost for Plant & Equipment and the
formula in cell H8 checks that this is consistent. Excel 97
enables additional validation formulas and conditional formatting
formulas to be added to cells, but these cannot be easily seen in the
formula bar and so can add unnecessary complexity.
- Be careful when using the Solver because it works like a blind
man trying to feel his way to the top of a mountain and so can think
that it has reached the top when in fact it has only reached the top of
a foothill along the way.
An independent review of a spreadsheet is one of the most important
means of obtaining some comfort as to model integrity. A major
pitfall is delegating too far this often critical role. The person
assigned this job should be fully briefed on the purpose of the model,
how it is structured and the key results of the model. In our
experience, the review is most effectively done on screen with input
variables verified against source records, formulae logic checked and
the application of the formulae to input data tested. All this
should be documented on a hard copy document.
Model Checking Tools
One solution to the problem of understanding and validating spreadsheet
models is to use third party tools such as the Spreadsheet Detective
(www.SpreadsheetDetective.com)
which has been developed by the first author. Exhibit 3
shows how the Detective has used blue shading and horizontal or
vertical stripes to clearly indicate which cells have formulas and
whether they have been copied from a cell to their left or above
respectively. Unlike Excel's Edit/Go To/Special option, all
the formulas in a spreadsheet can be properly classified at the same
time.
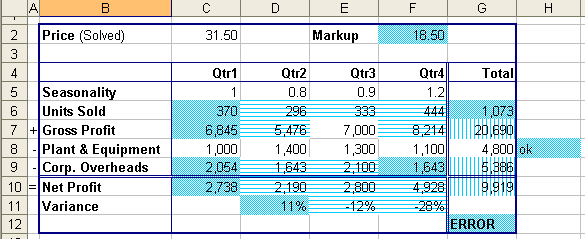
Exhibit 3
Exhibit 4 shows annotations that describe the formulas more
accurately. The blue text in each red box contains the text of
the formula in the corresponding cell, thus cell C9 contains the
formula " =30%*C7". The dots and lines show how the formula has
been copied throughout the spreadsheet, so cell E9 contains " =30%*E9"
but F9 contains a different formula. The circle in E7 indicates
that it does not contain a formula, while the lines with "R"s
highlights the fact that the ranges being used by the Sum in cell G6
does not include C6.
A1 references have also been clarified by inserting abbreviations of
labels that describe them in the annotation. Thus the annotation
in cell C9 is actually "= 30% * C7`GrossProfit". The green
annotation in B9 indicates that the Named range "PlantEquip" has been
defined to be the range C9:G9, which makes it easy to see the error
with this definition.
The annotated spreadsheet can be printed and soberly reviewed.
User experience with FormScheme indicates that in many instances review
time can be dramatically reduced (by the order of one half to two
thirds of the time) and the quality of the review enhanced.
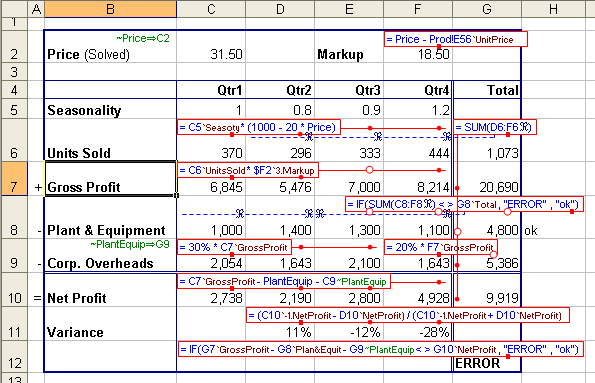
Exhibit 4
Conclusion
Survey and anecdotal evidence suggests that spreadsheet errors are
common. These errors could potentially cost companies millions of
dollars in new projects and other business decisions.
An appropriate response to these risks is to:-
- develop and strictly follow good practice modelling protocols, a
number of which have been outlined in this article;
- require an independent review by someone equipped to do so; and
- consider the use of software tools to improve the effectiveness
of any review.
References
Panko, R. and Halverson R. 1996. Spreadsheets on Trial: A Survey of
Research on Spreadsheet Risks. Proc.
Hawaii International Conference on System Sciences.
Freeman, D. 1996. How to Make Spreadsheets Error-Proof, Journal of Accountancy, Vol 181 Nr
5 May 1996.
Davis, N. and Ikin, C. 1987. Auditing Spreadsheets, Australian Accountant Dec 1987.
Galletta D.; Hartzel, K.; Johnson, S.; Joseph, J. and Rustagi, S.
1996. An Experimental Study of Spreadsheet Presentation and Error
Detection. Proc. Hawaii Intl.
Conf. on System Sciences.
Dr Anthony Berglas has a doctorate in
computer science which investigated technology for end user computing,
and can be contacted by E-Mail at ABerglas@uq.net.au.
Peter Hoare, B Bus MBA ACA ASIA is a
senior consultant with KPMG Management Consulting.